


America’s demographic makeup is changing and, in the process, dramatically transforming the nation’s workforce, workplaces, and consumer markets, as well as social, economic, and political institutions. Moreover, our shifting demographics are changing both the composition and complexion of the nation’s elementary and secondary school-age populations—the next generation that will fill seats in higher education institutions, compete for jobs in our dynamic and ever-changing economy, and fuel economic growth through their consumer purchasing power.
Shifting demographics are changing our nation. Together, U.S. Census Bureau data from the American Community Survey, annual Census Bureau estimates of components of demographic change, and the Current Population Survey provide the latest and most accurate information on America’s changing demographics and bear out this trend.
Given the strategic role talent development plays in maintaining our global competitiveness, higher education institutions in particular must respond to both the opportunities and challenges that undergird our shifting demographics. Our ability to thrive, prosper, compete, and coexist as a nation will hinge on the extent to which we effectively understand and adapt to our own demographic changes.
Disruptive Domains
Major shifts are occurring in the geographic distribution, racial and ethnic mix, age composition, and living arrangements of the U.S. population that will likely change America forever. Four overarching themes illustrate the societal impacts of the nation’s shifting demographics.
Theme 1: The South Rises Again
A major geographical redistribution of the American population is underway, with growth in the South outpacing all other regions.
For the first three-quarters of the 20th century, the South was believed by many to be economically backward and racially oppressive. As a consequence, it was a place to leave as opposed to a migration destination, as evidenced by the massive African American exodus in the Great Migration following World War I and World War II. To the extent that the region grew during this period, it was largely due to natural population increase—an excess of births over deaths. The South accounted for only about 30 percent net national population growth in each decade between 1910 and 1970.
However, in a dramatic demographic reversal, the South has captured more than half of the net national population growth in every decade since 1970. Between 2010 and 2017, for example, the South’s population grew by 9.1 million, an absolute increase that represented 55 percent of the nation’s total net growth of nearly 16.7 million (see Figure 2).
Most of this growth was due to migration from other regions of the country, especially the Northeast but also the Midwest and the West, as well as from abroad. Moreover, the South was the only region in the U.S. to experience net in-migration from all of the major demographic groups during this period, including white, black, Asian, Hispanic/Latinx, older adults, and both native- and foreign-born immigrants. (Throughout this article, "white" and "black" refer to members of those groups who are not of Hispanic or Latin origin or ethnicity.)
Some newcomers to the South are attracted to the region’s warmer climate, natural and cultural amenities, and lower cost of living. Others are coming to take advantage of education, business, and employment opportunities in the region’s emerging hot spots of entrepreneurialism and innovation. And, still others who were born in the region are returning as retirees or caregivers for family members.
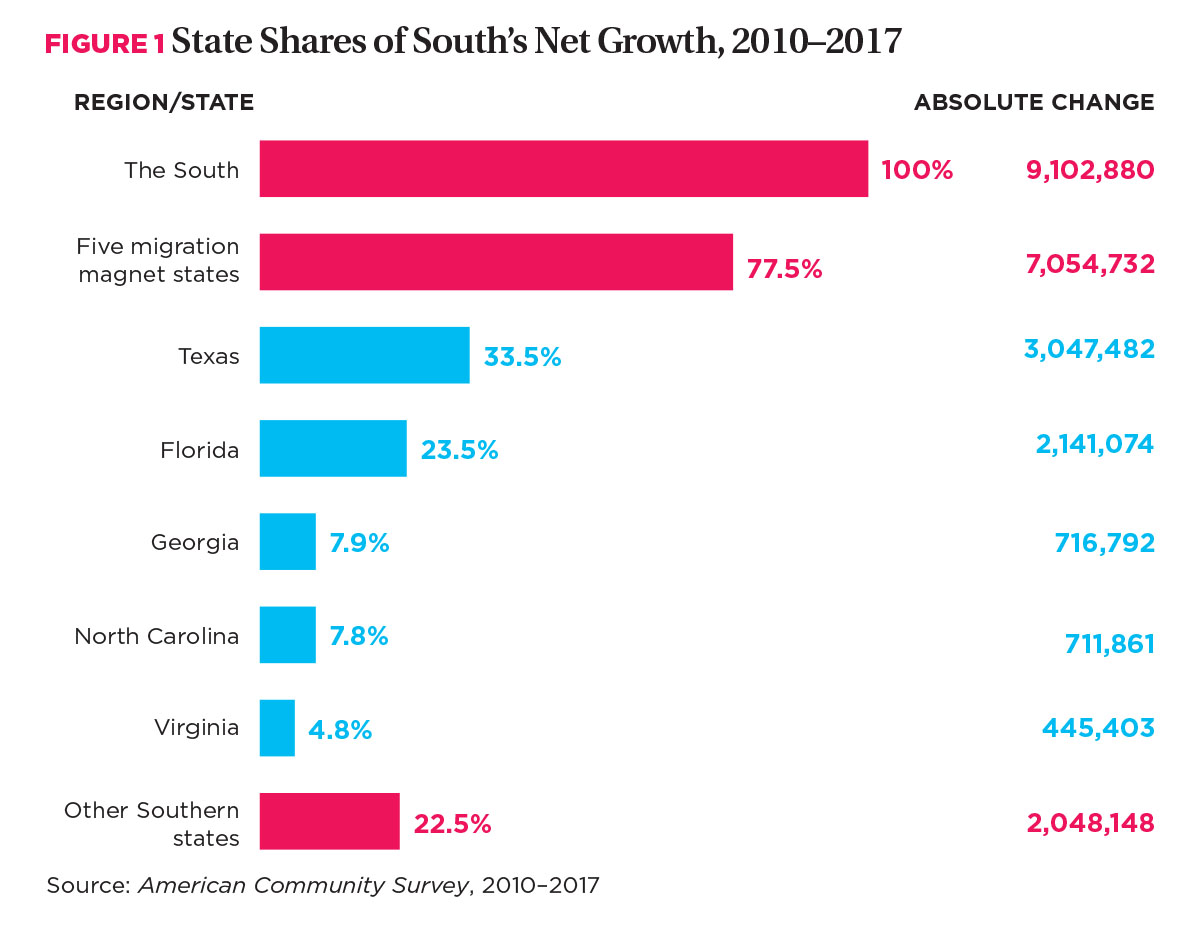
This is not to say that population growth is evenly distributed throughout the South. Continuing a nearly two-decade trend, more than three-quarters of the region’s net population growth between 2010 and 2017 (77.5 percent or 7.1 million) was concentrated in five migration magnet states—Texas, Florida, Georgia, North Carolina, and Virginia (see Figure 1). The other Southern states (Delaware, Maryland, South Carolina, West Virginia, Alabama, Kentucky, Mississippi, Tennessee, Arkansas, Louisiana, and Oklahoma) combined, plus the District of Columbia, captured the remaining one-fifth (22.5 percent or 2.0 million) of the region’s net growth.
Theme 2: Diversity Gains Ground
Two demographic trends accompany the geographical redistribution of the U.S. population. The first is the changing racial/ethnic composition and complexion of the U.S. population. During the past quarter century, this change has been driven by immigration to the United States, especially from Asia, Latin America, and the Middle East.
Other contributing factors include sharp increases in intermarriage rates between foreign- and native-born individuals of various racial/ethnic backgrounds, and overall slow growth among the white population (0.4 percent) compared to total population growth for the U.S. of 5.6 percent between 2010 and 2017. By contrast, the multiracial/biracial (34 percent), Asian (21 percent), Hispanic/Latinx (18 percent), Native Hawaiian/Pacific Islander (12 percent), foreign born/immigrant (11.3 percent), and black (6.3 percent) populations all grew more rapidly than the nation as a whole. These most rapidly growing demographic groups are mainly people of color.
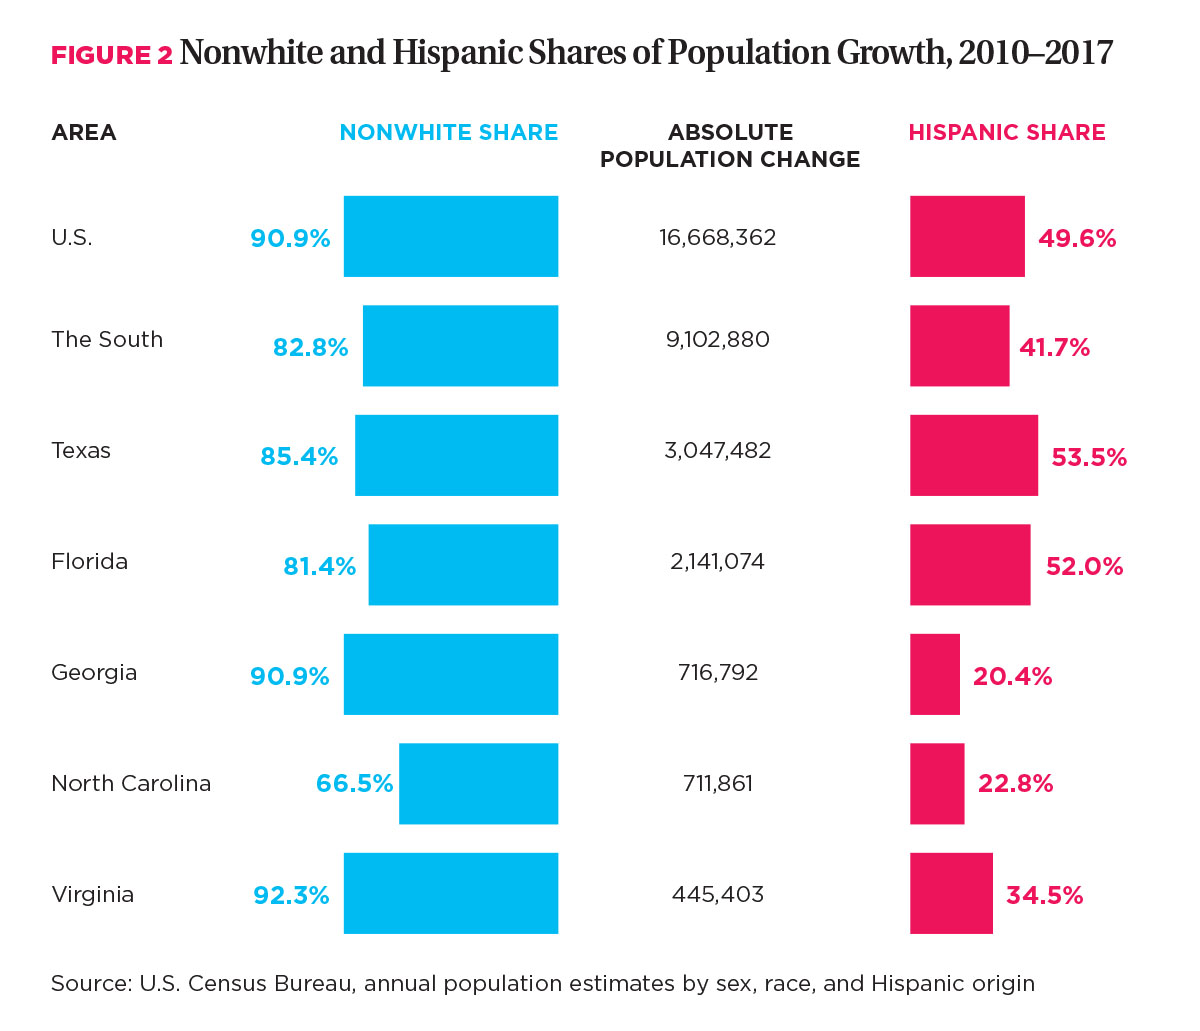
As a consequence of this pattern of growth, nonwhites accounted for 91 percent of U.S. net population growth between 2010 and 2017, with Hispanic/Latinx populations accounting for 50 percent of that growth (see Figure 2). And, in the five migration magnet states in the South (noted in theme 1), the nonwhite share of total net regional growth in those states ranged from nearly 67 percent to 92 percent, with the Hispanic/Latinx share alone accounting for 20 percent to 54 percent of total growth.
Theme 3: The Graying of America
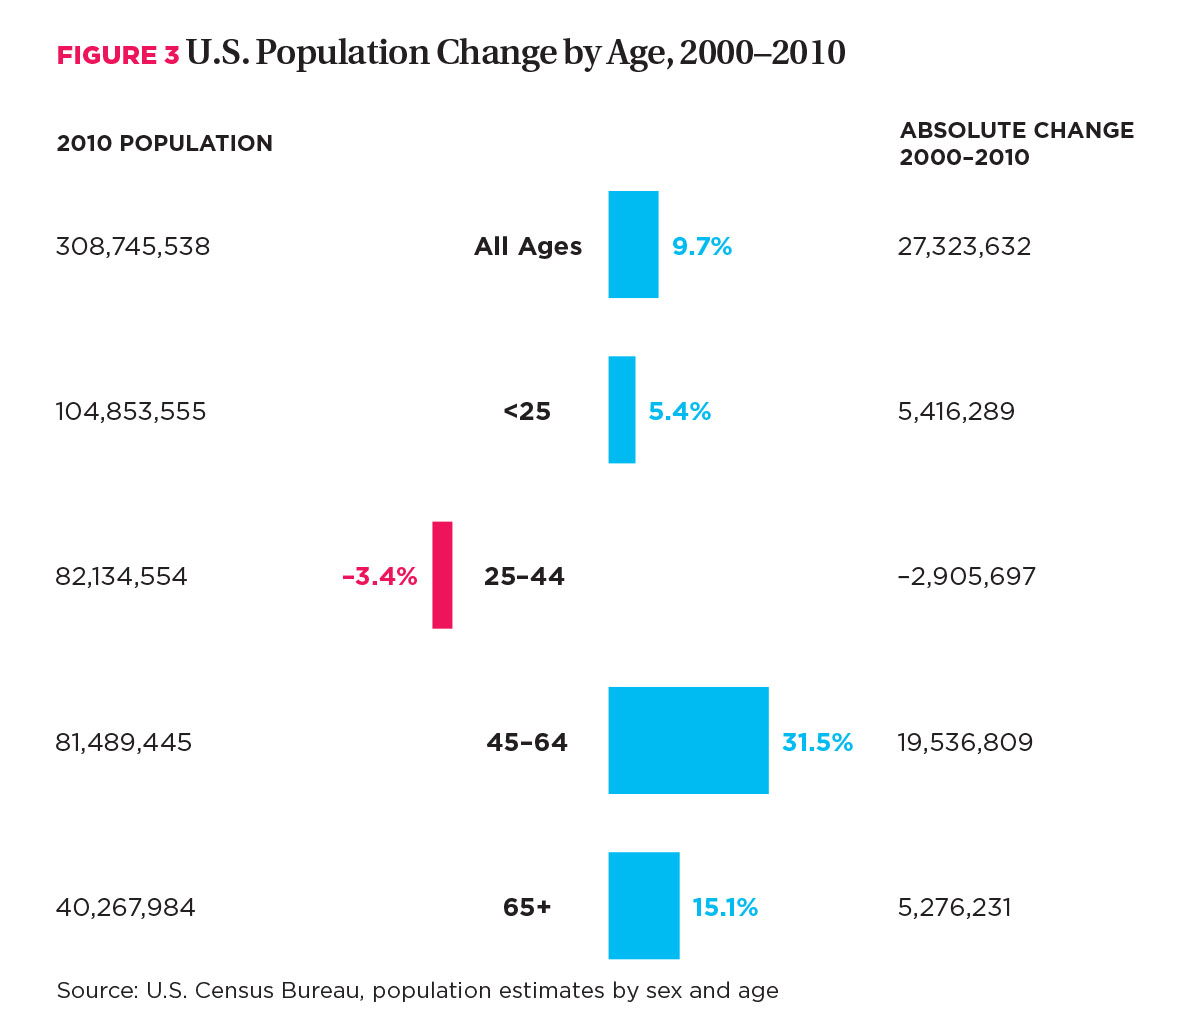
At the same time that America is diversifying, it is also graying (aging) as a consequence of the maturing of the post–World War II baby boom cohort, increased life expectancy among the nation’s senior population, and declining fertility rates, especially among white females. Boomers—a group that is disproportionately white—are defined as the 81 million people in the U.S. born between 1946 and 1964. Boomers began turning 65 at the rate of 10,000 per day in 2011 and will continue to do so at that rate through 2031. Moreover, they will live on average another 18.7 years beyond the age of 65 (see Figure 3).
Despite this extended life expectancy, the number of deaths exceeded the number of births among whites between 2010 and 2017, setting the stage for a major racial/ethnic transition in the American population. In part, deaths now exceed births among whites because fertility rates have declined for the past quarter century, especially among native-born, white women. Further, the percentage of women between the ages of 40 and 44 who have chosen not to have children doubled between 1976 and 2006, rising from 10 percent to 20 percent during that time period—a trend that seems likely to continue to grow.
As a consequence of this demographic dynamic, the white total fertility rate—a statistical measure of the expected number of births each woman will have—has been below the replacement level (2.1 births per woman) for almost two decades, and is currently at 1.7 births. Further, white females—with a median age of 45 in 2017—are aging out of their childbearing years much more rapidly than are black, Hispanic/Latinx, Asian, and other women of color, who are much younger with larger proportions still in their childbearing years. (By comparison, Hispanic/Latinx women in 2017 had a median age of 30 years with a fertility rate matching the replacement level of 2.1 births.) Differences in the median ages of white women versus women of color creates a huge white versus nonwhite fertility gap, which means that children of color constitute an increasing share of births—and by extension, an increasing share of the current and future school-age population.
Theme 4: The Grandparent Caregiver
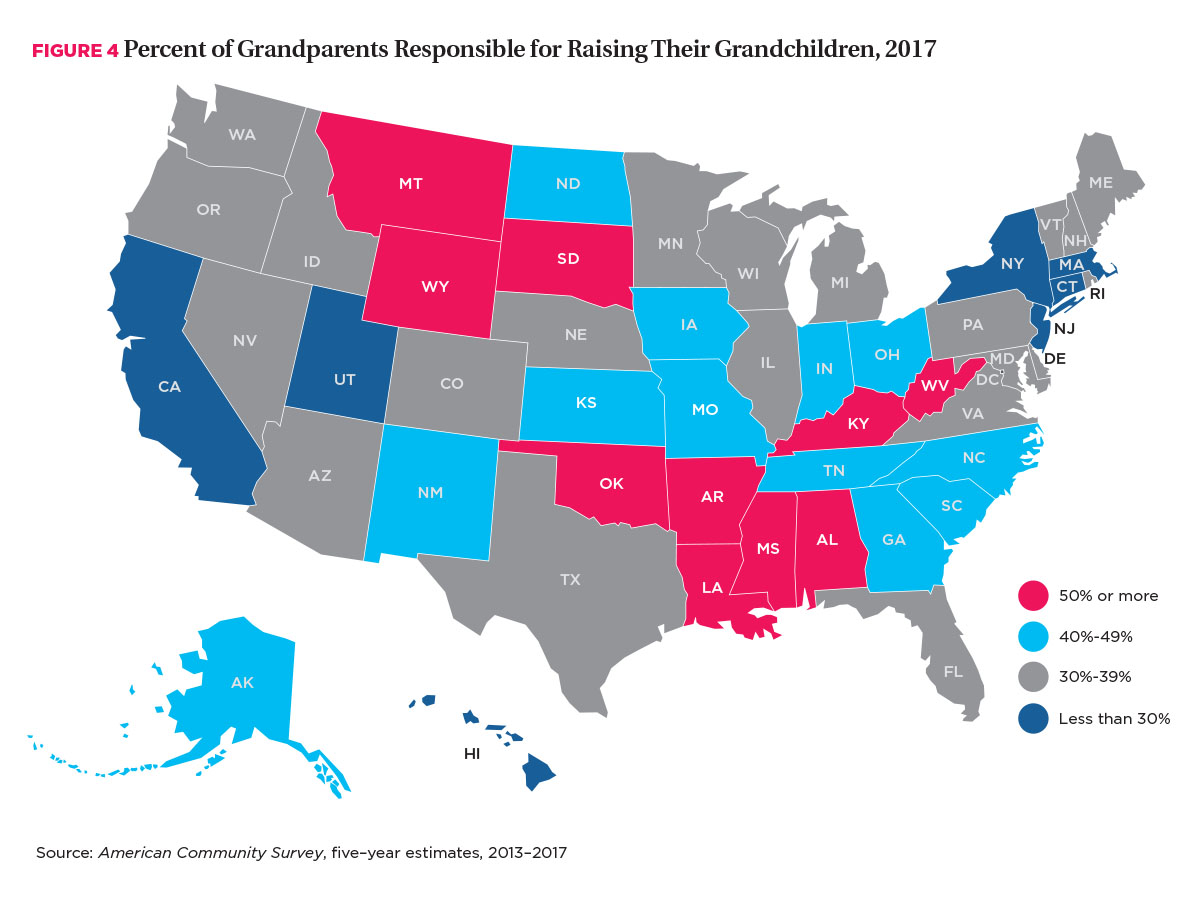
Yet another influence on the current and future student population entering America’s secondary and higher education classrooms is the increase in extended-generation households. There is a profound shift in living arrangements taking place in the United States, and nowhere is this more apparent than in households where children are present. Specifically, an increasing number of youth are growing up in households where one or both grandparents are present and oftentimes responsible for their well-being (see Figure 4).
Most school-age children (90 percent) live in households with one or both of their biological parents. But, in 2017, 7.6 million children lived in a household where one or both grandparents were present. Of those, slightly more than one-third (2.7 million) lived in a household where one or both grandparents were present, but not solely responsible for their care and well-being. One or both of the biological parents were also present in these households. And yet, for nearly two-thirds (4.9 million) of those school-age children living in households where one or both grandparents were present, the grandparents were solely responsible for their care and well-being. In those instances, close to half were being raised by both grandparents, 42 percent by their grandmother only, and 7 percent by their grandfather only.
Between 2010 and 2017, children raised in grandmother-only and grandfather-only households increased by approximately 7 percent and 10 percent, respectively, while the number raised by both grandparents declined by 4.5 percent. Children raised by one or both of their biological parents with no grandparent present in the household decreased by 1.6 percent (1.1 million).
The geographic differences in where grandparents are raising grandchildren further illustrates the shifts in children’s living arrangements. More than half of grandparents in 10 states and more than 40 percent of grandparents in 12 additional states were responsible for raising their own grandchildren in 2017. In all but seven states across the country, at least one-third of grandparents were raising their own grandchildren.
Notably, more than half of these grandparents were between the ages of 30 and 59, with only 40 percent of these caretakers fitting the stereotypical image of a grandparent as someone who is over 60 years of age. Except for Asians, this was the case for grandparents in all racial/ethnic groups. Moreover, more than 40 percent of grandparent caretakers had been responsible for their grandchildren for a period of five or more years.
Implications for Higher Education
These U.S. population shifts are among the major demographic changes that require immediate attention by higher education institutions to prepare for more change ahead, both in terms of daily operations and in how college and university leaders must rethink student recruitment going forward. For instance, the spatial re-sorting of the population that accompanies the growing diversification and aging of America will create real challenges for many institutions, but it also presents new opportunities.
From our in-depth research and analysis of additional factors shaping the future success of school-age children—many of which are too detailed to address in the scope of this article—we assert the following: Today’s nonwhite youth, through no fault of their own, often face a triple whammy of geographical disadvantages. For instance, many are: 1) highly concentrated in counties where there is little or no political or financial support for their education; 2) residing in neighborhoods characterized by hyperresidential segregation (60 percent or more nonwhite); and 3) living in concentrated areas of poverty (household poverty rates of at least 25 percent and typically above 40 percent). These circumstances and conditions place more than 14 million mainly nonwhite youth at substantial risk of falling through the cracks of our nation’s K–12 education system, thus reducing their odds of qualifying for admission to college and acquiring the requisite skills to compete in the unsparing global economy of the 21st century.
- More direct involvement at the K–12 level. Given these conditions, a propitious opportunity exists for higher education institutions to be more engaged in K–12 education as a form of enlightened self-interest—that is, to ensure that a steady flow of talent from these more disadvantaged environments not only qualifies for college admission, but also successfully matriculates and graduates.
Activities can range from outreach programs designed to improve the quality of instruction to professional development for school administrators and teachers that address the barriers that children from disadvantaged circumstances face to university-sponsored and managed lab schools that serve as beta test sites for potentially scalable innovations that can transform entire K–12 education systems.
- More emphasis—and progress—on building an inclusive culture. Within higher education institutions, major effort is required to reinvent the educational experience with an eye toward ensuring that admitted students from diverse cultural backgrounds not only feel included but also feel that they belong in these institutions.
Helping faculty and staff deal with their own implicit biases, establishing and enforcing a zero-tolerance policy for overt acts of discrimination, and redesigning the curriculum so that young people from diverse backgrounds see themselves in their educational experience will all go a long way toward creating a sense of inclusion and belonging for the next and succeeding generations of college students.
Training also is required in K–12 outreach and efforts in order to reinvent higher education to help administrators, staff, faculty, and students engage in courageous conversations around issues of diversity, inclusion, and belonging. Educational institutions must create a culture and climate where those conversations are encouraged, embraced, and anchored in mutual respect for diverse opinions and perspectives that span the political and ideological spectrum.
- More focus on aligning HR policies and hiring practices with new demographic realities. Finally, higher education institutions must review existing HR policies to effectively respond to two demographically driven issues: 1) the caregiver challenges that existing personnel may face, and 2) the impending wave of boomer faculty and staff retirements.
Work-life integration polices likely will be in great demand moving forward, as more college and university personnel—aligned with trends in the general population—will have caregiving responsibilities, not only for their grandchildren but also, increasingly, for aging family members.
And, given the significant shift in the composition of future generations of college students, succession plans to replace retiring faculty and staff must be fully anchored in the understanding that the next generation of talent to fill critical and high-level positions must be more diverse than our current one.
JAMES H. JOHNSON JR. is the William R. Kenan Jr. distinguished professor of strategy and entrepreneurship, UNC Kenan-Flagler Business School, and director, Urban Investment Strategies Center and Competitive Economies Idea Lab, Frank Hawkins Kenan Institute of Private Enterprise, Chapel Hill, N.C., and ALLAN M. PARNELL is senior research associate, Frank Hawkins Kenan Institute of Private Enterprise, Chapel Hill, N.C.